
Ishikawa Diagram
What is it?
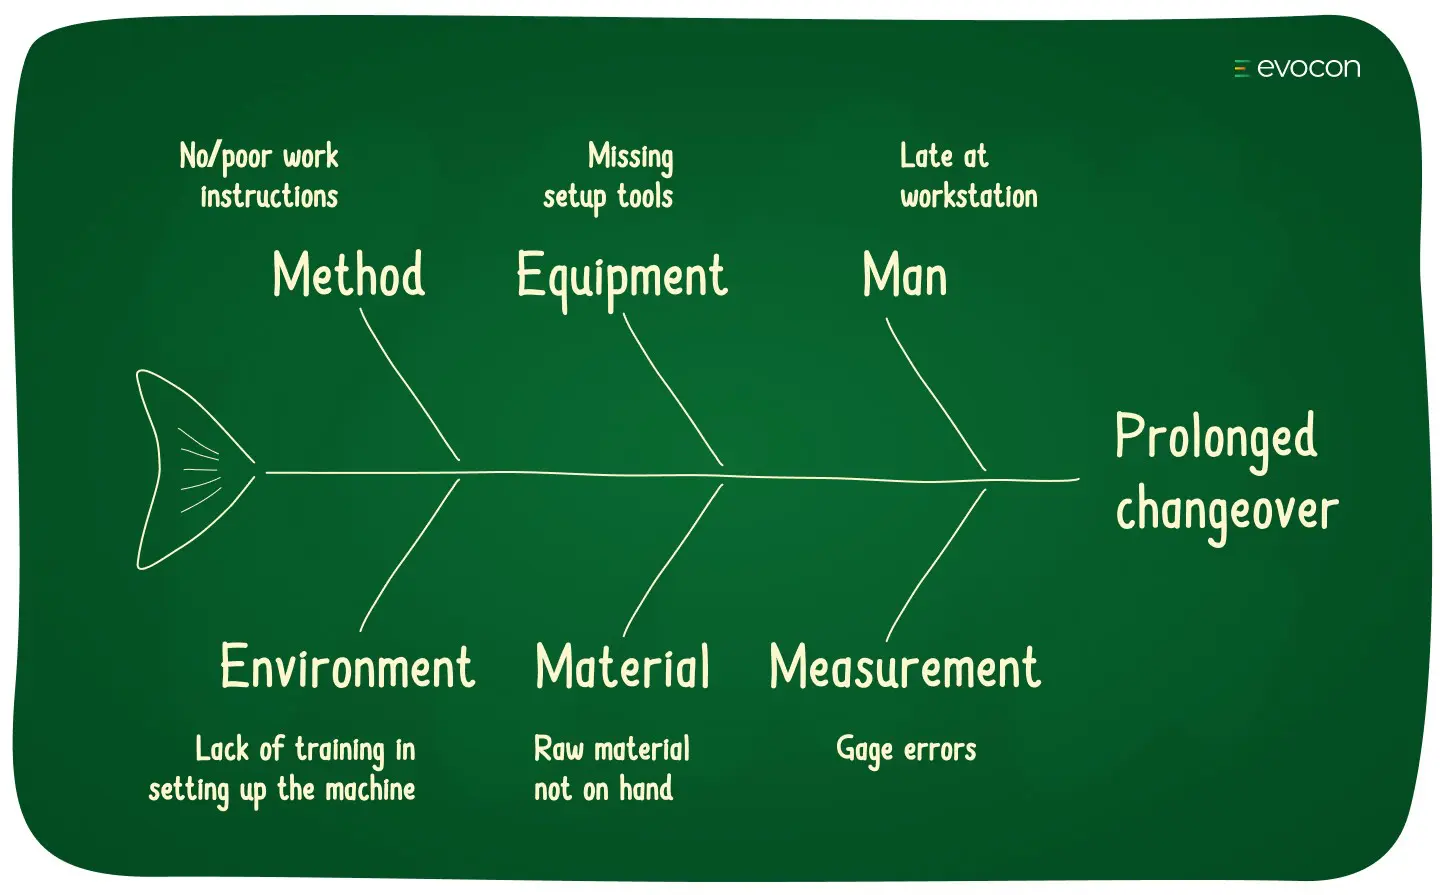
An Ishikawa Diagram, also known as a Fishbone Diagram or Cause-and-Effect Diagram, is a visual tool used to identify, analyze, and display potential causes of a specific problem or issue. It organizes potential causes into categories, typically represented as "bones" branching off a central "spine" that represents the problem. The diagram helps teams brainstorm, explore, and understand the root causes of a problem, facilitating problem-solving and continuous improvement processes.
How can it be useful to you? When you're faced with a problem and need to identify its root cause.
Consider a situation where your internet connection is not working properly. An Ishikawa Diagram helps you dissect the problem into smaller components, making it easier to understand the underlying reasons. The diagram resembles a fish skeleton, with the "spine" representing the problem (unstable internet connection), and the "bones" branching off the spine, depicting various categories of potential causes.
Categories might include:
- Hardware
- Software
- Network
- Service provider
Under each category, you would list specific potential causes:
Hardware:
- Router malfunction
- Outdated equipment
Software:
- Incorrect settings
- Outdated firmware
Network:
- Network congestion
- Poor signal strength
Service provider:
- Scheduled maintenance
- Infrastructure issues
By visually arranging the potential causes, the Ishikawa Diagram facilitates a systematic and comprehensive approach to brainstorming, analyzing, and identifying the root cause of the problem. It's a strategic tool that helps avoid overlooking important aspects when tackling issues, ensuring you get to the heart of the problem swiftly and efficiently.
The Ishikawa Diagram, also known as the Fishbone or Cause-and-Effect Diagram, is an essential tool for root cause analysis and quality management. Developed by Dr. Kaoru Ishikawa in the 1960s, the diagram is used to systematically identify, categorize, and analyze potential causes of a problem or quality issue, facilitating a deeper understanding of underlying factors and enabling targeted problem-solving.
The diagram's structure consists of a central "spine" representing the problem, with "bones" branching off into categories of potential causes. This visual arrangement encourages a comprehensive exploration of causal factors, while also promoting a systematic approach to problem-solving that aligns with other quality management methodologies and principles, such as:
- The Plan-Do-Check-Act (PDCA) Cycle: The Ishikawa Diagram can be used during the "Check" phase to analyze the effectiveness of changes and identify areas for improvement.
- The 5 Whys Technique: By repeatedly asking "why" a problem exists, the Ishikawa Diagram can be utilized to uncover root causes and ensure that the corrective actions address the core issue.
- Six Sigma: As a tool for root cause analysis, the Ishikawa Diagram complements the Define, Measure, Analyze, Improve, and Control (DMAIC) process used in Six Sigma methodology.
- Total Quality Management (TQM): The Ishikawa Diagram supports TQM's focus on continuous improvement and customer satisfaction by aiding in the identification of causes behind quality issues.
References
- Ishikawa, K. (1982). Guide to Quality Control. Tokyo: Asian Productivity Organization.
- Deming, W. E. (1986). Out of the Crisis. Cambridge, MA: MIT Press.
- Pyzdek, T., & Keller, P. (2018). The Six Sigma Handbook (5th ed.). New York: McGraw-Hill Education.
- Juran, J. M., & Gryna, F. M. (1988). Juran's Quality Control Handbook (4th ed.). New York: McGraw-Hill.